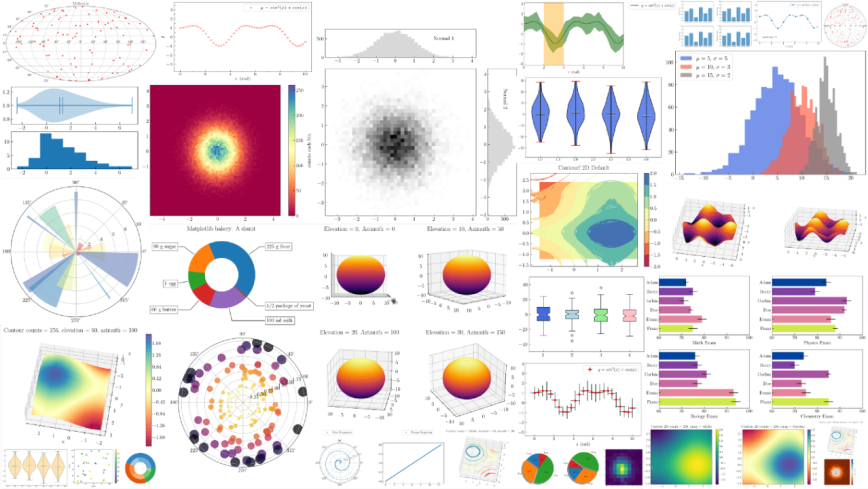
Matplotlib – In today’s data-driven world, the ability to effectively visualize data is crucial for gaining insights and conveying information. Matplotlib, a popular Python library, offers a powerful and flexible toolkit for creating high-quality visualizations. Whether you’re a data scientist, analyst, or developer, understanding Matplotlib can significantly enhance your ability to communicate data effectively. In this article, we’ll explore the features, benefits, and practical applications of Matplotlib.
What is Matplotlib?
Matplotlib is a Python library widely used for creating visualizations, ranging from simple line plots to complex, interactive charts. Developed by John D. Hunter, Matplotlib provides an extensive collection of functions and classes that enable users to generate publication-quality figures. It is an open-source project that seamlessly integrates with other Python libraries such as NumPy and Pandas.
Importance of Matplotlib
Data visualization plays a crucial role in data analysis, as it helps us understand patterns, trends, and relationships within datasets. Matplotlib empowers users to present data in a visually appealing and meaningful way. By leveraging its vast array of plotting functions and customization options, you can create stunning visual representations that aid in exploration, presentation, and storytelling.
Installation and Setup
Before diving into Matplotlib, you need to ensure that it is installed in your Python environment. Installing Matplotlib is straightforward and can be done using package managers like pip or conda. Once installed, you can import Matplotlib and begin harnessing its capabilities to visualize data.
Basic Plotting with Matplotlib
To get started with Matplotlib, you first need to understand its fundamental concepts. Matplotlib revolves around the concept of creating and modifying figures and axes. Figures serve as the canvas on which you create plots, while axes represent the actual plots themselves. By understanding these concepts, you can plot various types of charts, including line plots, scatter plots, bar plots, and histograms.
Customizing Plots
One of the strengths of Matplotlib lies in its ability to customize plots to suit your specific needs. From changing colors, markers, and line styles to modifying axis scales, labels, and titles, Matplotlib offers a wide range of customization options. By leveraging these capabilities, you can create visually stunning and informative plots that effectively communicate your data.
Working with Multiple Plots
In many scenarios, you may need to visualize multiple plots within a single figure. Matplotlib provides various techniques for arranging and organizing multiple plots, such as subplots and gridspec. With these tools, you can create complex visualizations that compare and contrast different aspects of your data.
Plotting Data from Files
Often, data resides in external files such as CSV or Excel files. Matplotlib seamlessly integrates with Python’s file-handling capabilities, enabling you to read data from files and plot it directly. This feature simplifies the process of visualizing large datasets and allows for easy updating of plots as new data becomes available.
Advanced Plotting Techniques
Matplotlib offers several advanced techniques that can take your data visualization to the next level. These techniques include 3D plotting, animations, geographical plotting, and interactive visualizations. By exploring these advanced features, you can create immersive and engaging plots that captivate your audience and bring your data to life.
Conclusion
In conclusion, Matplotlib is an indispensable tool for data visualization in Python. Its extensive functionality, flexibility, and ease of use make it a go-to library for individuals working with data. Whether you’re a beginner or an experienced data scientist, Matplotlib empowers you to create visually compelling and informative plots.
With Matplotlib, you can unleash your creativity and effectively communicate your findings to others. From basic line plots to advanced 3D visualizations, the library offers a wide range of capabilities to suit your needs. By customizing plots, working with multiple plots, and leveraging advanced techniques, you can create visuals that engage and captivate your audience.
In addition, Matplotlib seamlessly integrates with other popular Python libraries, such as NumPy and Pandas, making it a powerful tool for data analysis and exploration. By combining the capabilities of these libraries, you can extract insights from your data and present them in a visually appealing manner.
In conclusion, mastering Matplotlib is a valuable skill for anyone involved in data analysis, research, or visualization. By harnessing its power, you can unlock the full potential of your data and effectively convey your message.
FAQs
1. Is Matplotlib only compatible with Python? Yes, Matplotlib is a Python library and primarily used in Python environments. However, its functionality can be accessed through other programming languages via wrappers and interfaces.
2. Can I create interactive plots with Matplotlib? Matplotlib provides limited interactivity by default. However, you can enhance interactivity by combining Matplotlib with libraries like Plotly or by using Matplotlib’s interactive features in Jupyter notebooks.
3. Are there any alternatives to Matplotlib? Yes, there are several alternatives to Matplotlib, such as Seaborn, Plotly, and ggplot. These libraries offer different styles and functionalities for data visualization, so it’s worth exploring them to find the one that best suits your needs.
4. Can I save my Matplotlib plots in different file formats? Absolutely! Matplotlib supports saving plots in various file formats, including PNG, JPEG, PDF, SVG, and more. This flexibility allows you to use your plots in presentations, reports, or web applications.
5. Is Matplotlib suitable for large datasets? While Matplotlib is capable of handling large datasets, it may not be the most efficient choice for extremely large datasets. For big data visualization, specialized libraries like Dask or datashader might provide better performance.
Now that you have a comprehensive understanding of Matplotlib and its capabilities, why wait? Start exploring the world of data visualization with Matplotlib and unlock the potential hidden within your data.
com Domain Registration | Buy a .com Domain Name Today
Search The Domain Name You Want com Domain Registration – The internet has become an
-
Best Ransomware Detection Techniques
22 May 2023 -
What is Drupal used for?
22 May 2023 -
Is PrestaShop a CMS or Framework?
22 May 2023


